Kathy Lin
To gain adequate visibility into your distributed applications, you need to observe those applications at different levels of granularity. This means that you need to be able to query collected telemetry data both at the level of the whole application and at the level of selected components. Thanks to the power of Datadog tagging, you can already do this by aggregating your metrics within any scope of your choosing. For example, you can calculate the maximum value for any metric across your entire infrastructure to gain a bird’s-eye view, or you can determine that maximum within an individual part, such as a specific host or availability zone.
In some situations, however, you might want to combine the query results from multiple hosts in a subsequent query. For example, if you want to vertically scale your hosts (VMs or cloud instances), it’s helpful to know the p95 across all hosts’ maximum values for CPU usage. This query requires first calculating the maximum CPU usage value of each host and then comparing those hosts’ maximum values to each other to calculate the 95th percentile.
To help you reveal this type of information, Datadog now offers nested metric queries, which offer enhanced flexibility and control when you perform complex queries on large datasets. Nested queries allow you to use the results of one query as input to a subsequent one. With this new flexibility, you can now perform queries on query results—which is useful for provisioning and in other key scenarios—without having to manually export the data for refiltering or reaggregation.
In this blog post, we’ll explore how nested queries help you:
- Uncover flexible insights with multilayer aggregation
- Confidently allocate resources with percentiles on count, rate, and gauge metrics
- Visualize long-term trends without sacrificing granularity
Uncover flexible insights with multilayer aggregation
Nested queries offer the flexibility to reaggregate query results for many individual resources and apply as many time and space aggregation layers as you need to summarize data and uncover the insights you’re searching for.
Without nested queries, every metric query has just one mandatory layer of time aggregation and one optional layer of space aggregation. This allows you to perform queries such as “For the metrics teams, what was the average memory used per container (space aggregation) every hour (time aggregation) for the last week ?” This starting query results in many distinct time series, as shown below:

With nested queries, you can append additional aggregations in time and space to the base query. So now, you can reaggregate the query above and calculate the maximum value across all containers, for example, by appending max (everything) to the end, as shown here:

This capability is useful because modern infrastructure changes constantly, leading to frequent churn in values for various tags, like podname, that are attached to short-lived components. In many cases, you won’t want to drill down into a particular host or container but instead want to aggregate behavior across groups of components, such as pods, hosts, or containers.
Load balancing Kafka topics
The multilayer space aggregation available in nested queries has helped enhance Datadog’s own streaming capabilities through better load balancing. At Datadog, we rely on Kafka for real-time data streaming. Balancing our Kafka topics is crucial to ensure the optimal performance, reliability, and scalability of our products. To prevent partition skew and uneven load distribution, we use Datadog ourselves to monitor partition distribution, identify imbalanced topics, and rebalance them if some brokers are overloaded.
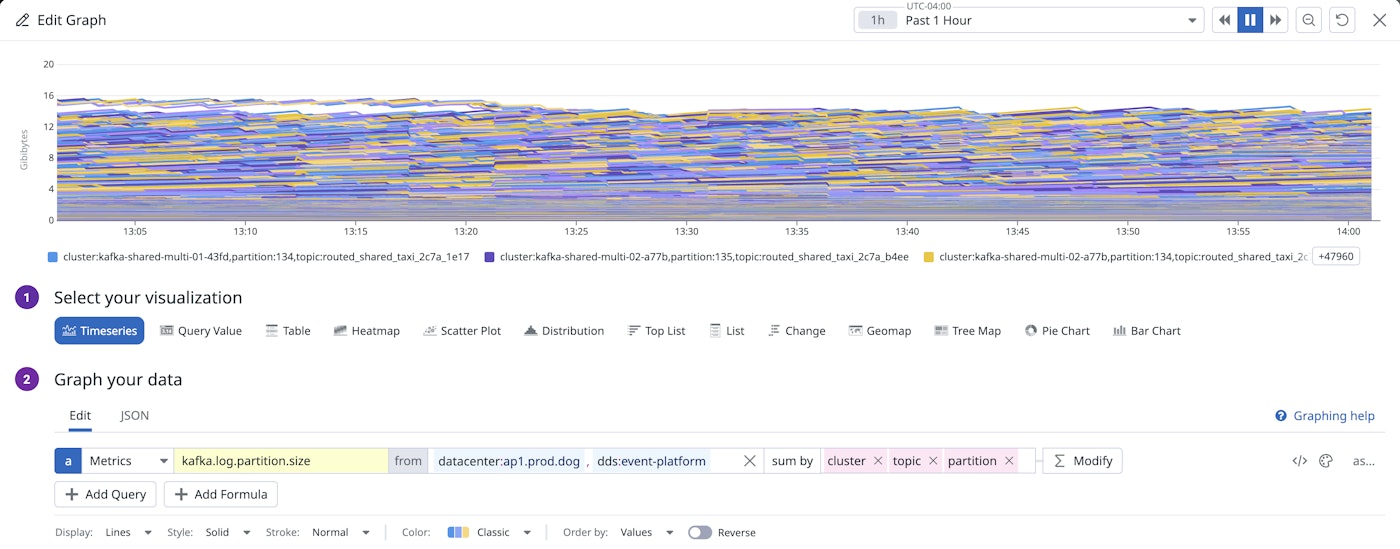
To show how we use multilayer space aggregation for load balancing, we can start by graphing the sum of the sizes of each Kafka cluster, topic, and partition log in Datadog via a query. This results in many different timeseries, as shown in the screenshot below. The imbalanced topics are challenging to pinpoint.

Now with the capability of multilayer space aggregation in nested queries, however, we’re able to better identify the imbalanced topics simply by adding an additional layer of space aggregation across clusterand topic tags. Now we can identify the clusterand topic pairs where the size difference is largest between the biggest and smallest partitions.

Resource capacity planning
Multilayer space aggregation can also be valuable for assessing resource utilization—that is, for identifying underutilized (oversized) resources as well as for capacity planning for future resource needs. For example, to reserve the correct amount of compute resources for the future, you need to analyze the current resource usage of containers over time.
To illustrate how you can improve visibility into resource utilization, we can build a nested query to perform multilayer time aggregation with the new metric system.cpu.system.total, released in Datadog Agent version 7.62. In this example, our goal is to accurately forecast CPU utilization based on the past three months to capacity-plan for the future. The new metric helps by allowing you to view the average, maximum, or even p95 CPU usage across cores (instead of across hosts or nodes) to reveal absolute measurements of CPU usage over time.
When you use this new metric in nested queries targeting Kubernetes clusters, for instance, you can review Kubernetes CPU usage that is first aggregated over short time intervals for precision, and then summarized over longer periods, to help accurately predict upcoming resource demand. To do this, you can begin by calculating the max metric value every 10 minutes for each node in a cluster to get a fine-grained view. As part of this query, you can sum all these nodes' maxes by cluster for all clusters dedicated to the workload in question. (In the screenshot below, the workload is designated by the prefix "parent.") Then, you can aggregate again in time to a human-readable granularity of two hours. This allows you to capture data over the entire past three months without sacrificing the minute-granular accuracy of the original query.

Confidently allocate resources with percentiles on count, rate, and gauge metrics
While distribution metrics provide server-side-aggregated, globally accurate percentiles calculated from your metric’s raw values, you may also be interested in percentiles on the aggregated queries on count, rate, or gauge type metrics.
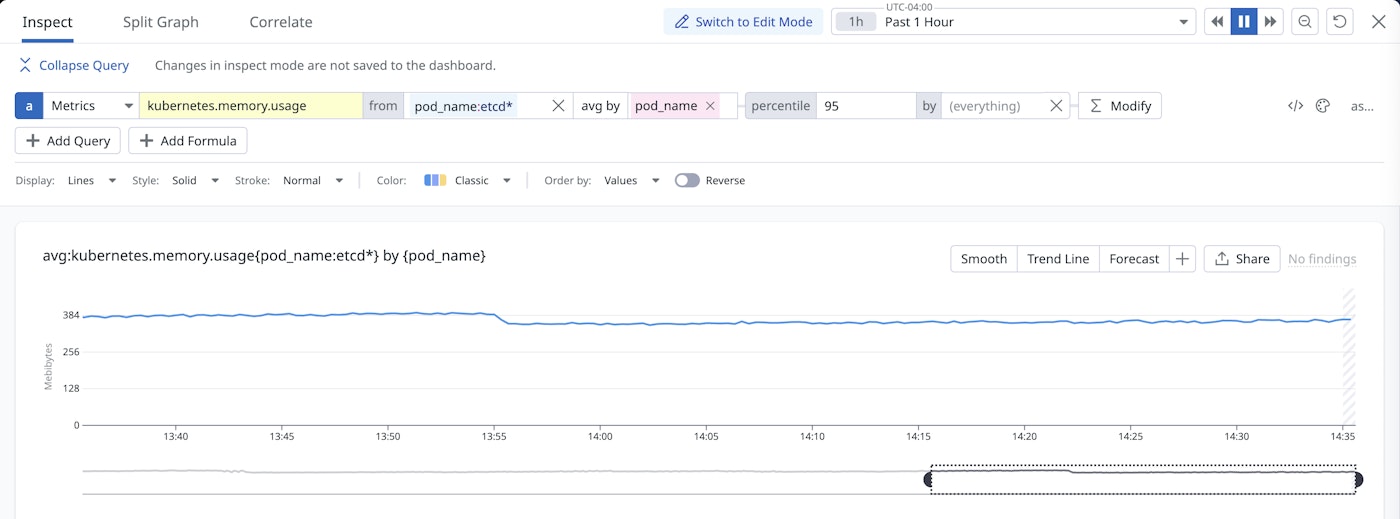
Nested queries let you determine percentiles from aggregated non-distribution metrics. For example, in a containerized environment, understanding the p95 of all containers of a given workload can indicate whether you’re properly provisioning the right amount of resources. You can easily obtain that 95th percentile now with a nested query like the one illustrated below:

This technique can also be useful for network engineers who use Datadog’s Network Device Monitoring product. In this use case, you can use nested queries to gain insights into your daily SNMP device bandwidth utilization over time. For example, to view the average, p95, and even p98 of your max daily SNMP bandwidth utilization over the past year, you could use a nested query like the one shown below:

Visualize long-term trends without sacrificing granularity
Analyzing long-term data at the same level of granularity at which that data was originally submitted can provide valuable insights for executive business reporting, quota tracking, and resource allocation. Without nested queries, as your query’s time window grows, the default rollup interval also grows—causing your query results to become less fine-grained. Now with nested queries, you can retain the higher resolution even over long timeframes.
For example, let’s suppose you are interested in monitoring the memory consumption of your pods on a minute-by-minute basis over time. In this case, you might want to know the maximum RAM a certain group of pods uses over any minute this week vs. last month. To find this out, you can use the following nested query:

Start using nested metrics queries today
Datadog’s nested queries provide you with the flexibility to craft powerful, multi-step queries without needing to manually export and calculate values. You can use its capabilities to perform multilayer aggregation or create long-term, high-resolution query results on any metric or business KPI that you value—at the level of granularity that is optimal for your needs.
If you don’t already have a Datadog account, you can sign up for a 14-day free trial to get started.


